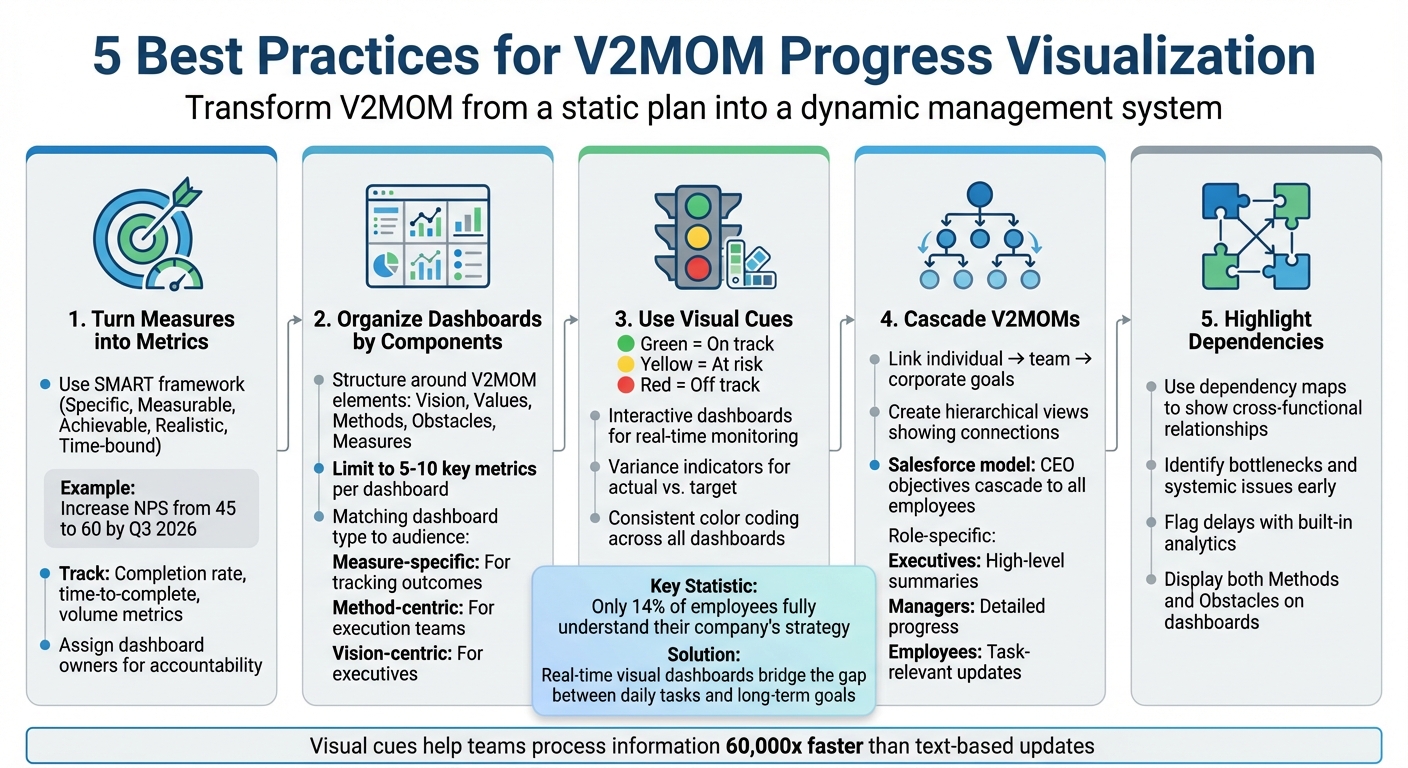
Tracking progress in V2MOM is critical for ensuring alignment and achieving goals. Adding visual tools like dashboards and workflows transforms V2MOM from a static plan into a dynamic management system. Here's a quick breakdown of how to make it work for you:
- Turn Measures into Metrics: Use specific, trackable data points (e.g., "Increase NPS from 45 to 60 by Q3 2026") and assign accountability.
- Organize Dashboards: Create dashboards by V2MOM components (Vision, Values, Methods, Obstacles, Measures) to ensure clarity. Limit metrics to avoid overload.
- Use Visual Cues: Apply tools like traffic light systems and interactive dashboards for quick updates and better engagement.
- Cascade V2MOMs: Link individual and team goals to the corporate vision for better alignment.
- Highlight Dependencies: Identify cross-functional obstacles early with dependency maps and analytics.
Why it matters: Real-time visibility into progress helps teams stay aligned, address challenges early, and make data-informed decisions. Tools like V2MOM dashboards simplify this process, ensuring everyone understands their role in the bigger picture.
5 Best Practices for V2MOM Progress Visualization and Dashboard Design
How Do You Visualize Project Progress With Dashboards?
Core Principles for Progress Visualization
Real-time progress tracking is a game-changer for V2MOM dashboards, turning them into dynamic tools that link metrics directly to your strategic goals. By following these principles, you can ensure your dashboards provide clarity and keep everyone aligned with what truly matters.
Converting Measures into Metrics
Marc Benioff highlights the importance of making measures tangible through numerical outcomes [7]. In practice, this means translating vague goals into specific, trackable data points. The SMART framework - specific, measurable, achievable, realistic, time-bound - is a reliable tool for setting clear, actionable targets [7]. For instance, instead of saying "improve customer satisfaction", reframe it as "increase Net Promoter Score from 45 to 60 by Q3 2026." This shift allows you to track progress using metrics like completion rate (percentage toward goal), time-to-complete (weeks remaining), and volume metrics (current score versus target). Assigning a dashboard owner to each metric ensures accountability and keeps efforts on track [3].
Organizing Dashboards by V2MOM Components
To prevent information overload, structure your dashboards around the key components of your V2MOM. When tracking outcomes, focus on measure-specific dashboards - dedicate a page to each major measure, such as revenue growth or customer retention. These pages should consolidate related KPIs, obstacles, and ownership details, while limiting the view to 5–10 key metrics for clarity [7]. For teams managing execution steps, method-centric dashboards work best. Meanwhile, executives benefit from vision-centric dashboards that offer a high-level overview of progress. This targeted organization ensures every team member accesses the information they need without sifting through irrelevant data.
Applying Visual Cues for Quick Interpretation
Visual cues transform raw numbers into easily digestible insights. A traffic light system - green for on track, yellow for at risk, and red for off track - provides instant status updates [1]. Interactive dashboards further enhance usability, enabling real-time monitoring without requiring deep dives into data [1]. Tools like Klaxoon show how features like clearly divided sections, interactive boards, and visual voting can boost engagement and understanding of strategic plans [2]. Variance indicators that highlight gaps between actual and target performance, along with consistent color coding across all dashboards, help teams quickly grasp progress and alignment. These visual strategies ensure everyone stays on the same page, making it easier to track and achieve your goals.
Visualizing Alignment Across Cascaded V2MOMs
When every role connects directly to the company’s vision, alignment becomes more than just a concept - it becomes visible. Salesforce exemplifies this approach by using V2MOM as their "single most important management tool", scaling it from a startup framework to an enterprise-wide practice. Each team and employee creates their own V2MOM, cascading directly from the CEO’s objectives [5][6]. This structured approach creates clear visual links between individual tasks and corporate strategy, ensuring clarity and engagement at all levels. These connections set the foundation for deeper insights explored in later sections.
Linking Top-Level Vision to Individual Work
Start with a corporate V2MOM that outlines your company’s Vision, Values, Methods, Obstacles, and Measures [5][6]. This document serves as the blueprint for aligning daily responsibilities with broader goals. Each business unit, team, and function should develop their own V2MOMs, explicitly supporting the corporate strategy. For instance, a team’s method might directly tie to achieving a specific corporate goal. On an individual level, employees should define how their projects contribute to team objectives, creating a clear, traceable line from their daily tasks to the company’s overarching vision.
Creating Hierarchical and Roll-Up Views
Interactive charts can help visualize the hierarchy by linking roles, reporting lines, and individual V2MOM goals across the organization [1]. Real-time dashboards provide tailored insights: executives get high-level summaries, managers can monitor detailed progress, and employees see updates relevant to their tasks. Roll-up views aggregate data seamlessly, showing how individual contributions feed into team, departmental, and corporate goals. These views highlight key performance indicators and completion rates, offering a transparent picture of progress. Tools like V2MOM.io enhance this process by providing real-time metrics on engagement, such as how often V2MOMs are created, approved, and updated, ensuring alignment at every level.
Understanding how different roles and tasks interconnect is just as important as tracking progress. This clarity helps identify potential challenges before they escalate.
Displaying Dependencies and Obstacles
Visual tools are invaluable for uncovering cross-functional dependencies and potential roadblocks. Since V2MOM explicitly includes both Methods and Obstacles, dashboards can highlight not only achievements but also the strategies for overcoming challenges [3]. Dependency maps make it easier to see which team methods rely on deliverables from other departments, uncovering bottlenecks or systemic issues early. Built-in analytics can flag delays, allowing leadership to act quickly. Additionally, interactive boards and visual workshops enhance collaboration by clearly showing interdependencies. This visibility fosters teamwork and ensures that obstacles are addressed in alignment with the company’s vision [2].
sbb-itb-ee93501
Designing Time-Based and Workflow Visualizations
Visualizations turn the V2MOM Methods into actionable strategies by mapping out task timing and progress. They help teams stay aligned, monitor milestones, and make adjustments when needed. This approach lays a strong foundation for tracking progress over time.
Time-Based Views for Milestones
Organize Methods with clear ownership and set quarterly timeframes. Add milestones where specific results are expected. For instance, a Method like "Grow social traffic" might include a Q1 milestone of "Publish 12 SEO articles" (output) and a Q2 milestone of "Increase organic traffic by 20%" (outcome) [8]. This creates a visual roadmap linking strategic actions to key deadlines. Since V2MOM emphasizes that Measures should be time-sensitive [7], timelines and milestone-based views make deadlines easy to see and manage.
Workflow Visualizations for Task Tracking
Milestones are just the start - visual workflows make task execution smoother. Tools like Kanban boards, with columns such as Planned, In Progress, Blocked, and Completed, are great for tracking tasks and progress. They help teams avoid bottlenecks by limiting tasks in each column. If a column hits its limit, teams must resolve existing tasks before adding new ones. This method isn’t limited to software teams - it can be applied across various departments. Visual workflows also enhance collaboration and retention, as people process visuals much faster than text-based updates [2].
Connecting Workflow Stages to Measures
As tasks are completed, related Measures update automatically. For example, completing a task might increment a Measure like "# of customer interviews completed." Interactive dashboards can reflect these updates in real time, keeping everyone informed about progress.
Interpreting Progress Visuals for Decisions
Progress visuals are powerful tools for driving action. The V2MOM framework - a dynamic management process designed for ongoing review and adjustment - relies heavily on these insights to guide execution [4]. By understanding what to look for and how to respond to gaps or opportunities revealed in your dashboards, you can refine your strategies and stay on track.
Spotting Trends and Variances
When analyzing data, focus on trends rather than isolated numbers. While a single data point shows where you stand right now, trends highlight where you're headed. Pay close attention to inflection points - moments when a metric changes direction. These shifts often hold more significance than whether today's number is above or below target.
For a clearer picture, pair leading indicators with lagging ones. For instance, if the number of customer interviews completed (a leading indicator) is declining while the customer satisfaction score (a lagging indicator) remains steady, it might signal you're relying on past efforts. This combination helps you avoid reacting to short-term fluctuations while identifying potential long-term issues early.
Making Data-Driven Adjustments
If your visuals point to underperformance, use the V2MOM components to guide your response. For example, if a Method isn’t delivering as expected, ask whether an Obstacle has shifted or if the Measure itself needs tweaking. Continuous performance data allows you to adjust Methods and Measures in real time. AI-powered tools can also provide valuable insights to refine your strategies based on what the data reveals.
The key is to keep your V2MOM dynamic. This means conducting frequent reviews, making real-time updates, and adapting Methods based on what your visuals are telling you. Avoid letting the framework become a static, once-a-year exercise [3][7].
Once you’ve made adjustments, interpreting the visuals accurately is critical to prevent missteps.
Avoiding Common Interpretation Mistakes
Don’t confuse activity with impact. Completing 50 tasks might feel productive, but only outcomes that align with your strategic goals truly matter. Simplify your dashboards by focusing on a few key Measures that drive results - too many metrics can obscure the insights you need [7][2].
Relying solely on lagging indicators is another common pitfall. By the time revenue drops, the damage is often already done. Instead, combine lagging indicators with leading ones to catch issues before they escalate. Additionally, include commentary alongside visuals to provide context that numbers alone can’t capture, such as external market changes or internal challenges.
Finally, establish a structured review cadence. This ensures your decisions are consistent, evidence-based, and deliberate - rather than reactive or driven by emotion.
Conclusion
Turning a static V2MOM into a dynamic execution tool can transform how your organization operates. By converting Measures into specific, trackable metrics, designing dashboards around V2MOM elements, and using visual cues to emphasize priorities, you create a system where alignment and accountability naturally fall into place.
Surprisingly, research shows that only 14% of employees fully grasp their company’s strategy[5]. When progress visuals are shared openly, they bridge the gap between daily tasks and long-term goals. This kind of transparency empowers teams to take decisive, data-informed actions that directly support the company’s vision.
These visuals aren’t just for show - they’re tools for making quicker, smarter decisions. A consistent review process helps you spot and resolve issues early while capitalizing on emerging opportunities. Salesforce credits V2MOM as the backbone of their alignment strategy, connecting everyone from the CEO to individual contributors by clearly linking their work to the broader mission[5][6].
Upgrading from spreadsheets to a dedicated platform like V2MOM.io can take your strategy management to the next level. With interactive dashboards that provide real-time performance insights, built-in analytics to uncover bottlenecks, and collaboration tools for seamless goal tracking, this platform ensures full transparency and continuous improvement.
Start by ensuring your Measures are measurable and directly tied to your Vision. Simplify your dashboards to spotlight the most critical metrics and share these views across teams to strengthen coordination. With effective visualization practices, your V2MOM becomes more than a framework - it becomes the guiding compass that keeps your organization aligned and agile, no matter what challenges arise.
FAQs
What’s the best way to use dashboards to track progress in V2MOM?
Dashboards serve as an essential tool for keeping tabs on progress within the V2MOM framework. They allow you to clearly visualize key performance metrics, monitor goal progress, and pinpoint areas that require immediate attention - all in real time.
By diving into the data displayed on these dashboards, you can spot bottlenecks, adjust strategies, and maintain alignment across all teams. Plus, customizable and interactive dashboards enhance teamwork by ensuring everyone has access to the same information, making it smoother to work toward your V2MOM goals effectively.
What are the best tools for visualizing progress in V2MOM?
To keep track of progress within the V2MOM framework, consider using interactive dashboards to monitor key metrics in real time, organizational charts to outline team roles and responsibilities, and collaboration tools to simplify communication and share updates effortlessly.
You can also take advantage of AI-driven insights and customizable data visualizations to spot trends, evaluate success, and ensure your efforts align with strategic goals. These tools make it easier to stay focused and adjust plans when necessary.
How can I make sure my V2MOM measures are clear and trackable?
To make your V2MOM measures work effectively, aim for clear and measurable goals that tie directly to your strategic priorities. Rely on precise, data-based metrics to monitor progress and spot any obstacles along the way.
Utilize real-time dashboards and tracking tools to stay informed about engagement levels and outcomes. Consistently review and adjust your measures to keep them practical and in sync with your objectives. This method ensures you stay focused and achieve impactful results.